• Home
  • WORDPRESS
    • PLUGINS
    • PHP
    • Themes
    • DEVELOPMENT
      • Javascript
      • JQuery
      • Mootools
  • WEB DESIGN
    • DESIGN
    • CSS
    • HTML
  • TYPOGRAPHY
    • FONTS
  • RESOURCES
    • TUTORIALS
    • THEMES
    • SLIDERS
    • TECHNOLOGY
  • ARCHIVES
  • CONTACT
  • Advertise

Code Geekz

    • Most Popular

      All time

    • 30 Best Tools for Data Visualization

      37 Comments

    • Best PHP Frameworks for Developers

      33 Comments

    • Latest Stories

      What is new?

    • Building Product Teams That Scale: The Case for Remote .NET Developers

      May 21, 2025

    • Choosing a WooCommerce Theme? Here’s What Most Store Owners Get Wrong

      May 9, 2025

    • Comments

      Most Recent

    • B. Frances on:

      Best WordPress Wedding Themes

    • Ultimate Content Locker Pro on:

      Best WordPress Social Content Locker Plugins for 2017

  • Home
  • WORDPRESS
    • PLUGINS
    • PHP
    • Themes
    • DEVELOPMENT
      • Javascript
      • JQuery
      • Mootools
  • WEB DESIGN
    • DESIGN
    • CSS
    • HTML
  • TYPOGRAPHY
    • FONTS
  • RESOURCES
    • TUTORIALS
    • THEMES
    • SLIDERS
    • TECHNOLOGY
  • ARCHIVES
  • CONTACT
  • Advertise

Plotly : The Online Graphing Analytics Platform

1
  • by Gavin
  • In DEVELOPMENT · RESOURCES
  • — 15 May, 2014

Plotly is an online graphing and analytics platform. It’s a place where you can analyze data, make and share beautiful graphs, and discover content you love. It’s also a community. In this post, we’ll be highlighting a few of our favorite user graphs, and showing some of the key features available in Plotly. We’d love to hear your thoughts, suggestions and feedback. We’re at @plotlygraphs.

First up we’ll show a histogram from Alex Parker. The graph shows the number of Google results for the word “space” with different numbers of a’s. 55 and 96 are popular, with Google showing 2,970 results for space spelled with 96 a’s. If you hover your mouse over a point or click and drag to zoom in, you can learn more.

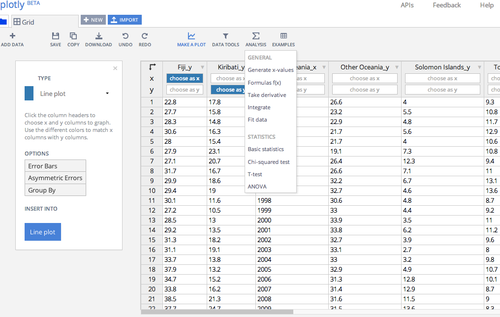
The next graph was made by Wired Science writer Rhett Allain, and comes from his video analysis of an exploding death star article.

Two fun things to point out here that you can do with Plotly: First, Plotly allows you to easily create fits for your data, as Rhett often does. Check it out below, or head over to our best fits gallery.


Second, you can embed your interactive plots in your blog post or website by putting your URL in this iframe snippet:
<iframe src="https://plot.ly/~etpinard/176/650/550" height="550" width="650" seamless="seamless" frameborder="0" scrolling="no"></iframe>
And here is how it looks when embedded.

plotly graphing analytics tool
One reason you might enjoy Plotly: It’s free, online, and doesn’t need to be downloaded or installed. You can also access data you find in other plots by using a tool in WebPlotDigitizer. In this case, we used a tool called WebPlotDigitizer to access the data in a Facebook Data Science post.

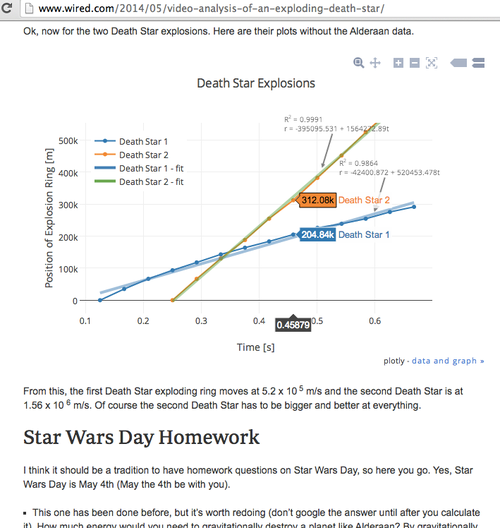
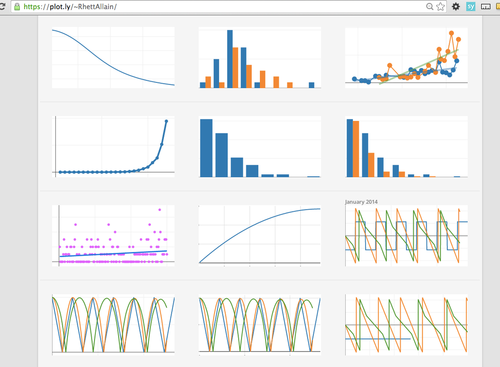
The best thing about Plot.ly, is that when someone like Rhett embeds a graph, he gives me an opportunity to connect with him and his work. If I click the “data and graph” link in his posts, I can make my own copy of his graph and view his data. I can also see his profile https://plot.ly/~RhettAllain/. He has all of his graphs there, much like you might keep all your photos on your Instagram profile. That lets you organize your projects and work all in one place where others can connect with you and see all your work and data.

plotly graphing analytics
Sharing data and graphs together is a key part of Plotly. When I see a graph, I can also see the data to test it, share it, or re-graph it. You can also fork graphs and add to them, using either an API or by just copy and pasting or uploading data from a csv or Excel file. Here’s how our grid looks:

plotly graphing analytics
 

Plotly also lets you live-stream data into your browser. To see how this was made, check out this Raspberry Pi Instructable.

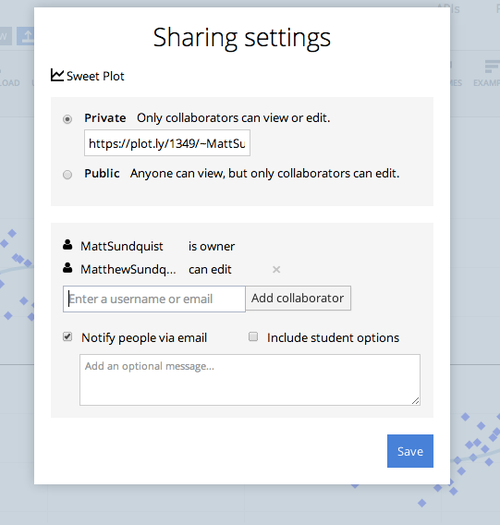
Plotly is also collaborative. Any graph you make you can keep private, or share with others. That means you can do all your data analysis, graphing, and collaboration in one place. No more emailing around files, graphs, screenshots, and presentations. You can do it all in Plotly.

Sharing.

plotly graphing tool
 

Version control, so you can refer back to and restore previous versions of your work.

plotly data graph tool
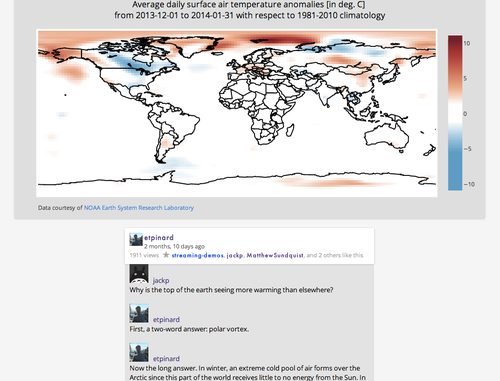
And discussion. The graph shown is here.

plotly data analyzing graph chart
The last one speaks for itself: the popularity of chocolates.
Plot.ly – The Free Data Analysis & Graphing Tool

Share

Tags: analytics platformdata analyzingdata graphingfree online graphing toolgraph chartshistogramsplotly

— Gavin

A Web addicted Geek stuck inside Tron.

  • Previous story 15 Free jQuery Plugins for May 2014
  • Next story Tools and Resources for Creating Gantt Charts

You may also like...

  • git errors 3 Git Errors Involving Redundancy and How to Fix Them
  • 16 Best HTML5 Frameworks for Rapid Development
  • 12 Best GIFs Compression Tools
  • Best Business Website Templates for Your Next Projects

Enter your em@il & get our posts delivered.


  • Enter your em@il & get our posts delivered.

  • Codegeekz
    • Home
    • DEVELOPMENT
    • Plotly : The Online Graphing Analytics Platform
    • Home
    • WORDPRESS
      • PLUGINS
      • PHP
      • Themes
      • DEVELOPMENT
        • Javascript
        • JQuery
        • Mootools
    • WEB DESIGN
      • DESIGN
      • CSS
      • HTML
    • TYPOGRAPHY
      • FONTS
    • RESOURCES
      • TUTORIALS
      • THEMES
      • SLIDERS
      • TECHNOLOGY
    • ARCHIVES
    • CONTACT
    • Advertise

    CODEGEEKZ.COM