A graph or chart or diagram is a diagrammatical illustration of a set of data, in which “the data is represented by symbols, such as bars in a bar chart, lines in a line chart, or slices in a pie chart”. Graphs must be accurate and convey information efficiently. They should be viewable at different computer screen resolutions.
Who needs software for building charts and graphs, an easy way to create charts and graphs for projects and applications is through jQuery plugins or JavaScript libraries. There are myriad of jQuery Chart and Graph plugins out there by which you can create various interactive, beautiful, and custom graph layouts.
Here is the list of some of the Best jQuery Chart and Graph Plugins.
Must Read –
JavaScript Libraries for Creating Circular Charts
1. OrgChart
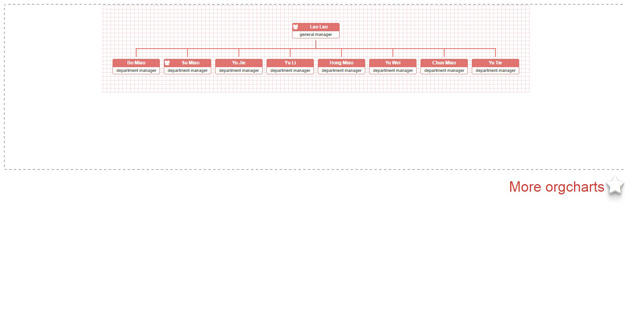
OrgChart is a simple and direct organization chart plugin based on pure DOM and jQuery.
2. ProgressPieSVG
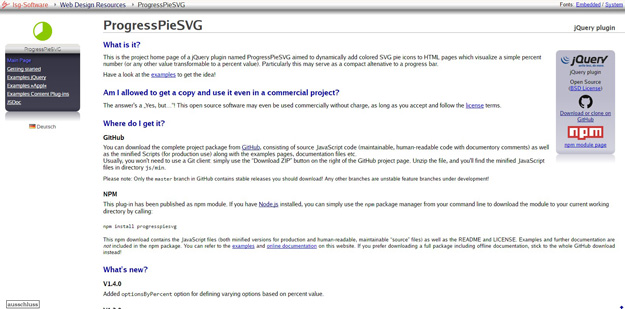
ProgressPieSVG is a jQuery Plugin for dynamically adding circular progress bars (rings) or pies to percent values in a website (visible or invisible). ProgressPieSVG is highly customizable and extensible.
3. Google Chart Scroller/Zoomer
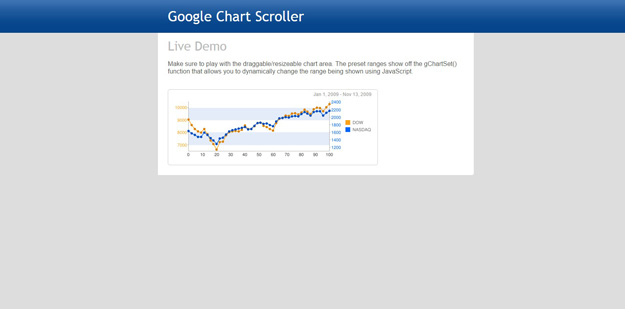
Create your own Google Chart and this jQuery plugin will transform it into a zoomable scrollable chart! You can even pass in a date range for the x axis and it will create the x axis labels for you. That’s something that the Google Chart API doesn’t provide you. Then, you can also pass in a date just like you do in PHP to get the labels formatted just the way you want.
4. jQuery Graph Plugin
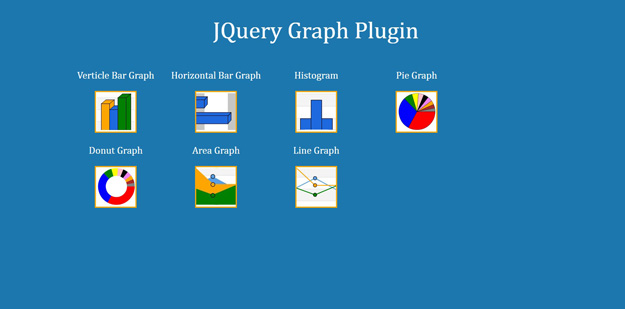
jQuery graph plugin simply lets you create various types of charts easily. You just need to add data of your columns and your graph is ready. It contains vertical graph, horizontal bar graph, line graph, donut graph and many more. You can even watch screenshot and live preview to get complete idea of product.
5. Chartli
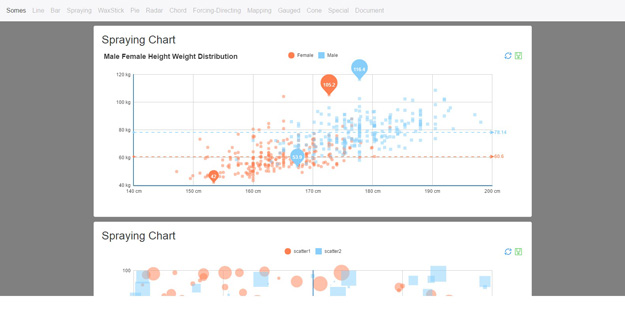
With this plugin you can create your own interactive line, bar, pie, radar, map cone, chort and various other types of charts easily. This plugin comes with numerous features such as easily customizable, customizable map charts, interactive elements, change color easily, and documentation file included.
6. Chartinator
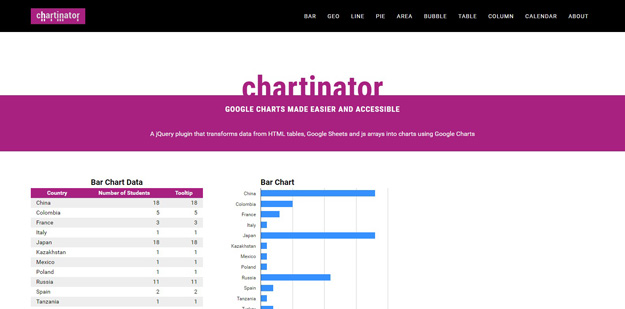
Chartinator is a jQuery plugin that transforms data from HTML tables, Google Sheets and js arrays into charts using Google Charts.
7. Chartify
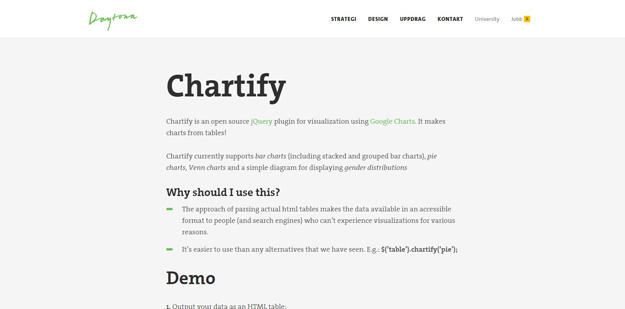
Chartify is an open source jQuery plugin for visualization using Google Charts. It makes charts from tables! Chartify currently supports bar charts (including stacked and grouped bar charts), pie charts, Venn charts and a simple diagram for displaying gender distributions.
8. jGraphUI
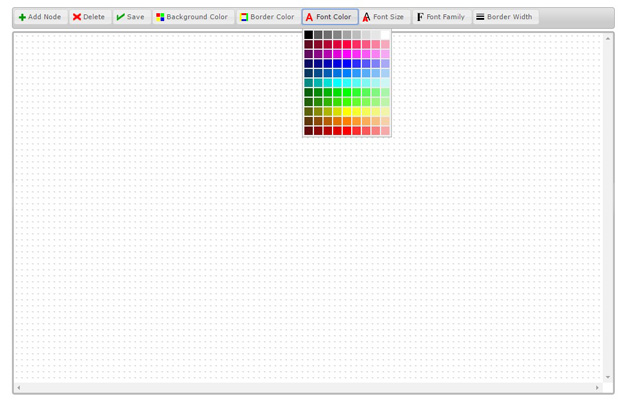
JGraphUI is a rich feature and highly customizable yet easy to use diagram tool and flowcharts, you can create, manipulate and save flowcharts and other types of diagrams.
9. CanvasJS
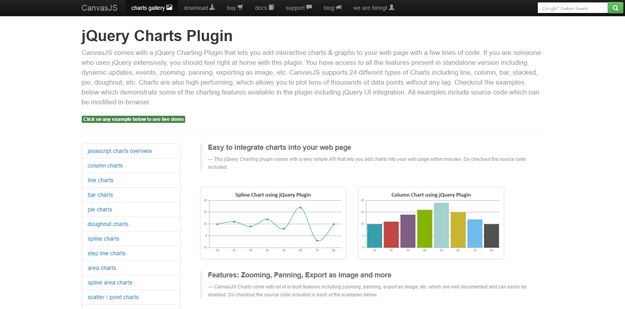
CanvasJS Charting Plugin for jQuery lets you add beautiful & interactive charts to your web page with a few lines of code.
Charts have high performance and can run across devices include Desktops, Tablets, iPhone, Android, etc. Supports features like dynamic updates, events, zooming, panning, etc.
10. Graphup
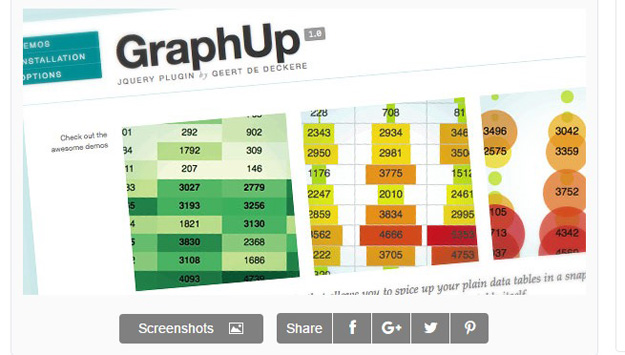
GraphUp is a very flexible and lightweight jQuery (v1.4+) plugin to spice up your data tables. It visualizes the values using color, bar charts and bubbles. Easily create your own cleaners, painters or color maps. Also, a callback is available to perform any operations on a cell before painting. Super flexible, endless possibilities! Check out the demos.
11. jQuery.Feyn
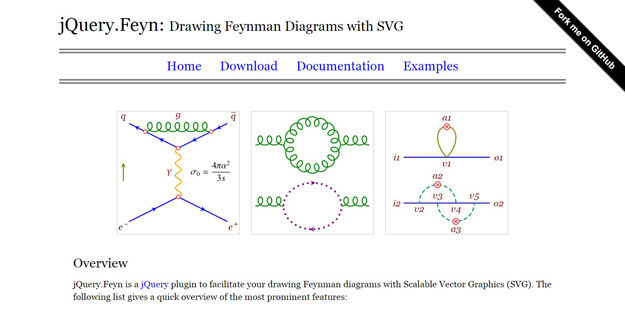
jQuery.Feyn is a plugin for drawing Feynman diagrams with SVG (Scalable Vector Graphics). It supports typesetting labels and including external graphics, it is lightweight, cross browser and fully documented.
12. Grafikon
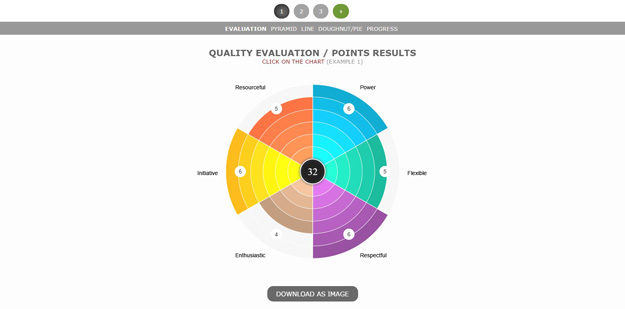
Grafikon is a JQuery Chart Plugin, that gives you the possibility to create your own unique chart with full customization. At present, there are six main modes: evaluation, pyramid, line, pie, doughnut and progress. Grafikon is easy to use and it is fully customizable – colors, sections, levels, fonts settings and many more. Also, Grafikon has a responsive option.
13. Circliful
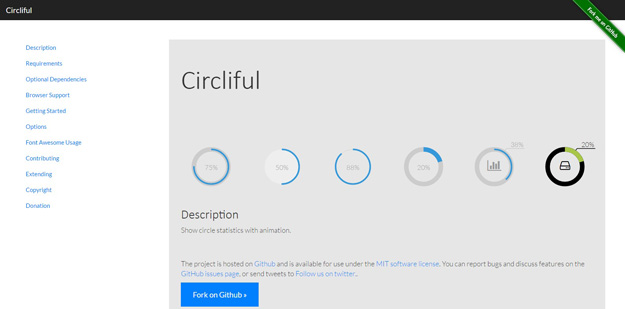
Circliful is a jQuery plugin for showing circle statistics. It comes with number of features such as based on html5 canvas and jquery, font awesome integration, show infos as circle statistics, no images used and many more.
14. HighChartTable
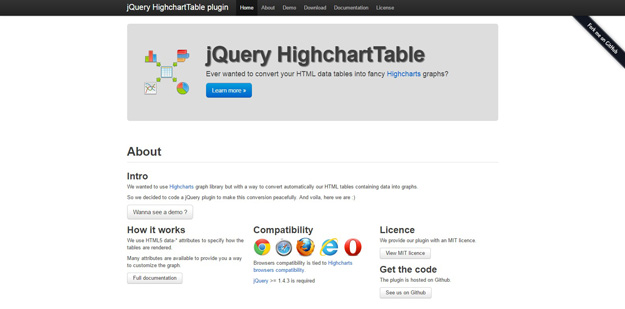
highchartTable is a jQuery plugin provides a simple way to convert HTML data tables to Highcharts graphs. Many attributes are available to provide you a way to customize the graph.
15. jQuery Responsive Google Chart Plugin
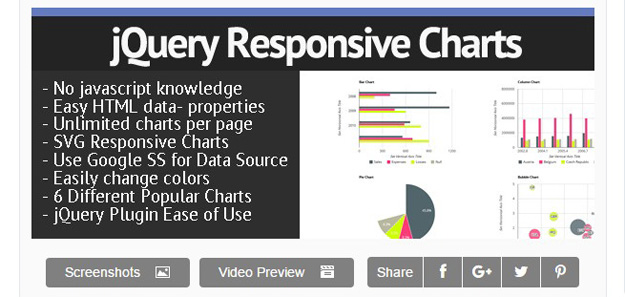
It’s now easier than ever to use Google charts in your website. No javascript knowledge or jQuery knowledge is required. You can easily set up nice, SVG, responsive charts on your websites by setting a few HTML data- properties. Here’s all the HTML you need to set up one of six charts.