In general, JavaScript is a pretty straightforward language where anyone can learn the basics within hours.
And, like any other language, some common mistakes and bad practices -which can be avoided easily- exist. Developers prefer this scripting language to improve user interface, provide rich features, or make various interactive elements on the website.
Debugging JavaScript can be quite painful and arduous activity for developers while developing web applications. Therefor in this article we have gathered some Best JavaScript Debugging Tools that will help you to debug scripts to achieve more accurate results. We hope you will find the list handy and useful for your web development projects. Have Fun !!
1. Json Formatter & Validator
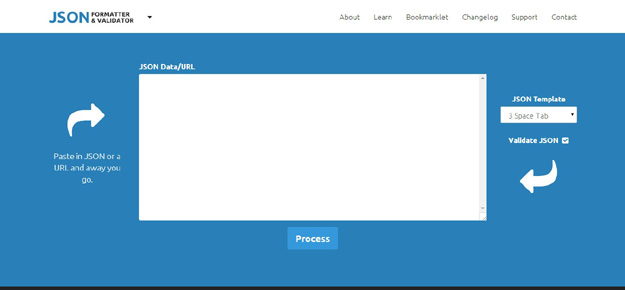
JSON Formatter created to help with debugging. As JSON data is often output without line breaks to save space, it is extremely difficult to actually read and make sense of it. This little tool hoped to solve the problem by formatting the JSON data so that it is easy to read and debug by human beings.
2. Debug
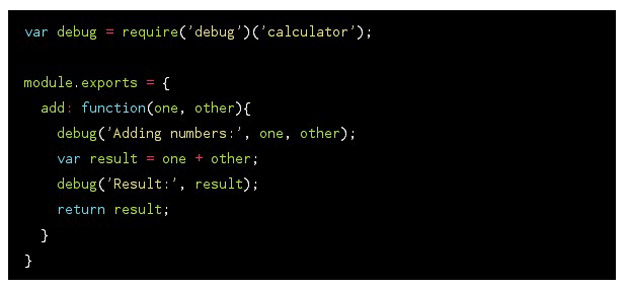
Debug is a small library for logging debug messages. Since it is just a wrapper around console.log, it works in both Node and the Browser. It allows you to filter logging output without changing your source and it also outputs time differences which lets you easily tell how much time has elapsed between log message.
3. JS Hint
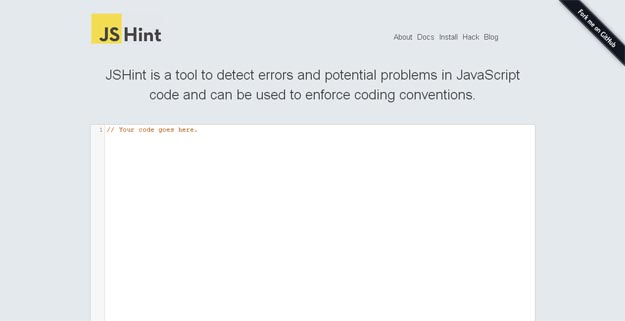
JSHint is a community-driven tool to detect errors and potential problems in JavaScript code and to enforce your team’s coding conventions. It is very flexible so you can easily adjust it to your particular coding guidelines and the environment you expect your code to execute in.
4. Grunt
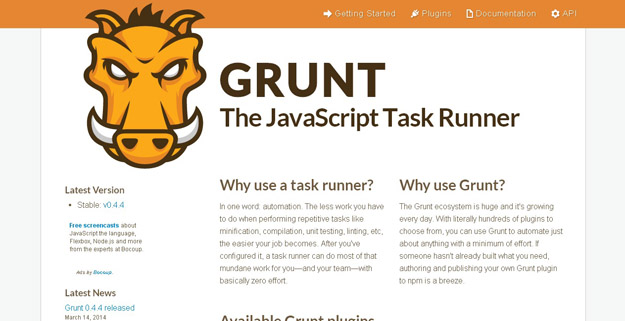
Grunt is a task-based command line build tool for JavaScript projects. It has the following predefined tasks that you can use in your project: Concatenate files, Validate files with JSHint, Minify files with UglifyJS, Run unit tests with node unit and etc.
5. JS Bin
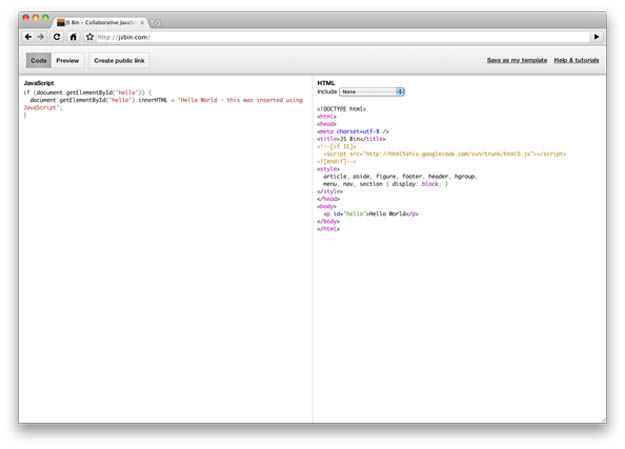
JS Bin is a webapp specifically designed to help JavaScript and CSS folk test snippets of code, within some context, and debug the code collaboratively. JS Bin allows you to edit and test JavaScript and HTML. Once you’re happy you can save, and send the URL to a peer for review or help.
6. JavaScript Shell
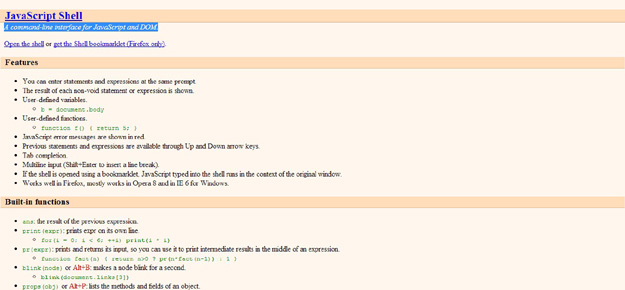
A command-line interface for JavaScript and DOM.
7. Javascript Debugger
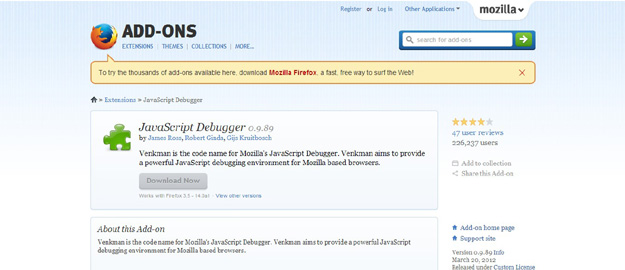
Venkman is the code name for Mozilla’s JavaScript Debugger. Venkman aims to provide a powerful JavaScript debugging environment for Mozilla based browsers.
8. jSdt
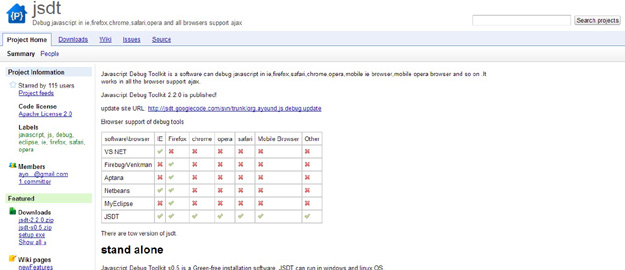
Javascript Debug Toolkit is a software can debug javascript in ie,firefox,safari,chrome,opera,mobile ie browser,mobile opera browser and so on .It works in all the browser support ajax.
9. DebugBar
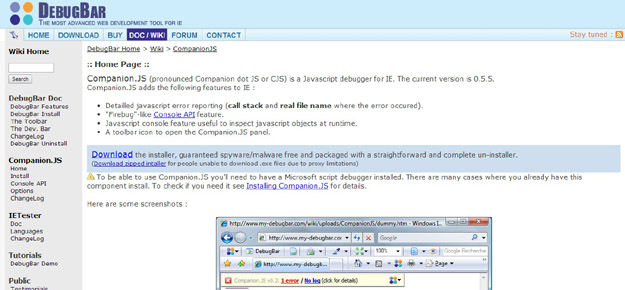
Companion.JS is a Javascript debugger for IE it has number of features like detailed javascript error reporting, firebug like console API feature, a toolbar icon to open the Companion.JS panel.
10. Simple State Manager
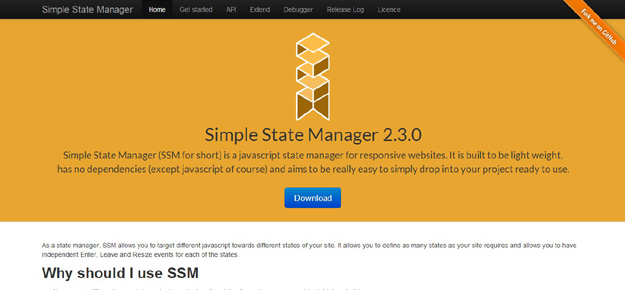
Simple State Manager is a lightweight and easy-to-use JavaScript State Manager for responsive websites. It doesn’t require any JavaScript frameworks and a perfect companion for handling layout-specific code in a clean way. You can define the breakpoints and pack all the JavaScript to be executed on that breakpoint. Once another breakpoint is reached, SSM disables all the previous custom code and triggers new ones (so you don’t have to).The manager comes with a complete API, a debugger and plugin support for extending further.
11. Uninson.js
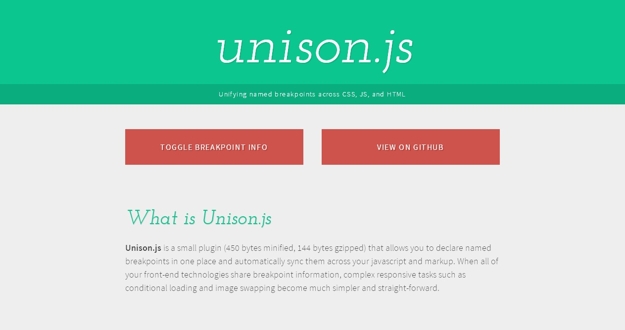
Unison.js is a tiny script (less than 1kb minified, gzipped) that enables us to declare breakpoints only once and use them both in JavaScript and markup. It requires a preprocessor like SASS, LESS or Stylus to function. And, behind the scenes, it uses the font-family property on the page’s head and title tags to store information. There is also a debug feature which prints the breakpoints to see them easier.
12. Tutti
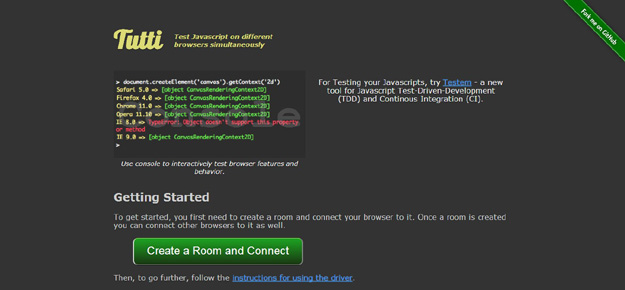
Tutti is a open source web application that enables you to interactively execute Javascript on multiple web browsers at the same time. It is used by simply creating a room (session) and connecting to that room by copy-pasting the unique URL generated from any browser you want. After that, when you execute a JavaScript command from the shell, it will be executed on every connected browser with the help of technologies like Socket.IO, node.js and WebSocket. Simply, it is a very handy resource for debugging JavaScript and analyzing inconsistencies between browsers.
13. Firebug
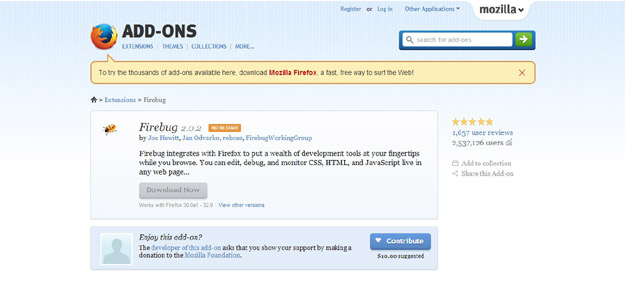
Firebug integrates with Firefox to put a wealth of development tools at your fingertips while you browse. You can edit, debug, and monitor CSS, HTML, and JavaScript live in any web page.
14. Dragonfly
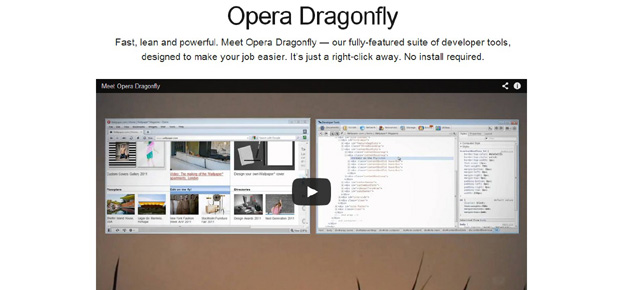
A full suite of tools puts you in control. Step through your code, manipulate the DOM, monitor network traffic, search for what you need, filter away what you don’t, and a whole lot more. Whether you are a developer or a designer, Opera Dragonfly has the tools to keep you covered.