An Infographics is a popular way of representing data which is used for turning information in to visual data. Infographics take stuffy, boring ol’ data and present it all in a fun, entertaining and easy-to-understand manner. Hence most of us use the infographic which, at its best, transforms complex information into graphics that are both easy to grasp and visually appealing.
There are myriad of Infographics, such as flowchart, timeline, versus Infographics, data visuals and more.
For this roundup we have compiled a list 13 Best Tools for Creating Infographics which will help you to craft basic infographics without much hassle and endeavors. They’re all free, or offer free versions. Let us know which ones you get on best with…
1. Easel.ly
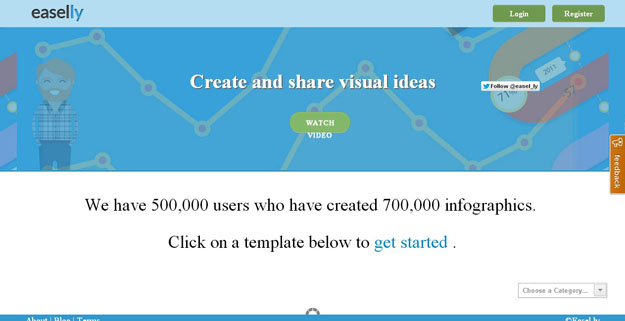
Easel.ly is a simple web tool that empowers anyone to create and share powerful visuals infographics, posters and many more. The tool offers a diversified collection of icons, symbols, characters and other objects. These are based on relevant themes classified under categories, such as education, e-commerce, music, nature, science and so on.
2. Piktochart
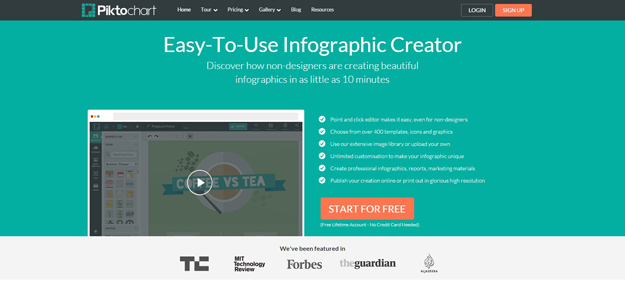
Piktochart is an infographic and presentation tool enabling you to turn boring data into engaging infographics with just a few clicks. Its repository contains an impressive collection of images, templates, icons and graphics. Piktochart offers various options to share or publish your Infographics online, including Slideshare and Evernote.
3. Vizualize
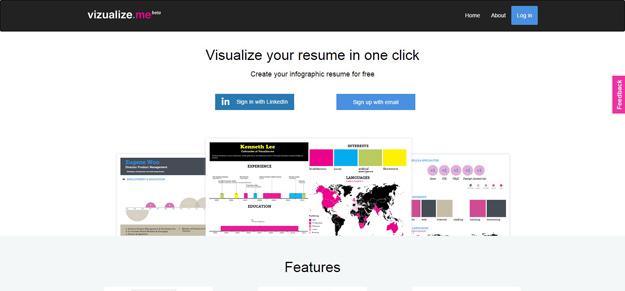
Vizualize.me is a popular Infographics resume making tool that lets you turn your mundane-looking resume in to an interactive one. You can visualise your resume in one click and also take a look at previous examples. Enabling people to express their professional accomplishments in a simple yet compelling personal visualisation, we think this is the start of something big.
4. Venngage
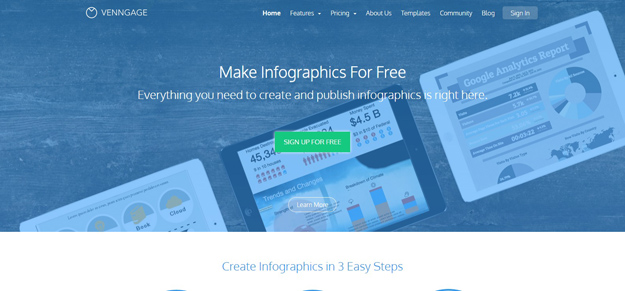
Venngage enables you to design a myriad of infographics, which you can integrate in to a business presentation, marketing material or an educational project. You can choose from templates, themes, and hundreds of charts and icons as well as uploading your own images and backgrounds, or customize a theme to suit your brand. You can animate them too!
5. Dipity
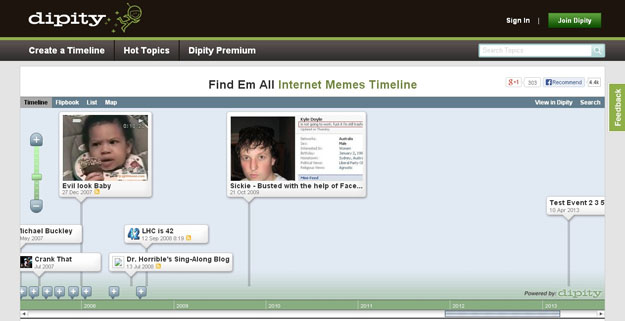
Dipity is a timeline website that organizes web content through time and date. Dipity is a great way to create, share, embed, and collaborate on interactive, visually engaging timelines that integrate video, audio, images, text, links, social media, location, and time stamps.
6. Get About
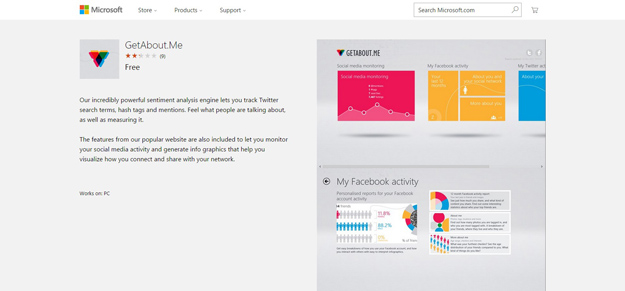
This free Windows app lets you monitor your social media activity and generate infographics that help you visualize how you connect and share with your network.
7. Visual.ly
Visual.ly is a community platform for data visualization and infographics set up in 2011. It allows you both to create infographics and get them shared on social media. Using its real-time collaboration tools, you can work on creative projects with multiple designers, share and market your work, reach out to clients, draw inspiration and do much more.
8. Creately
Creately lets you crate beautiful diagram, flowcharts, UML, UI mockups and many more. It offers 50+ types of diagrams with specialised features to help you draw fast and better, it offers real time collaboration and projects help you work with clients and colleagues. It offers a collection of diagram templates, shape sets, real-time collaboration and more.
9. Tagxedo
Tagxedo is a tool that creates a word cloud for the text that you provide. You can also customize it with different font types, shapes, layouts and color combinations.
10. Infogr.am
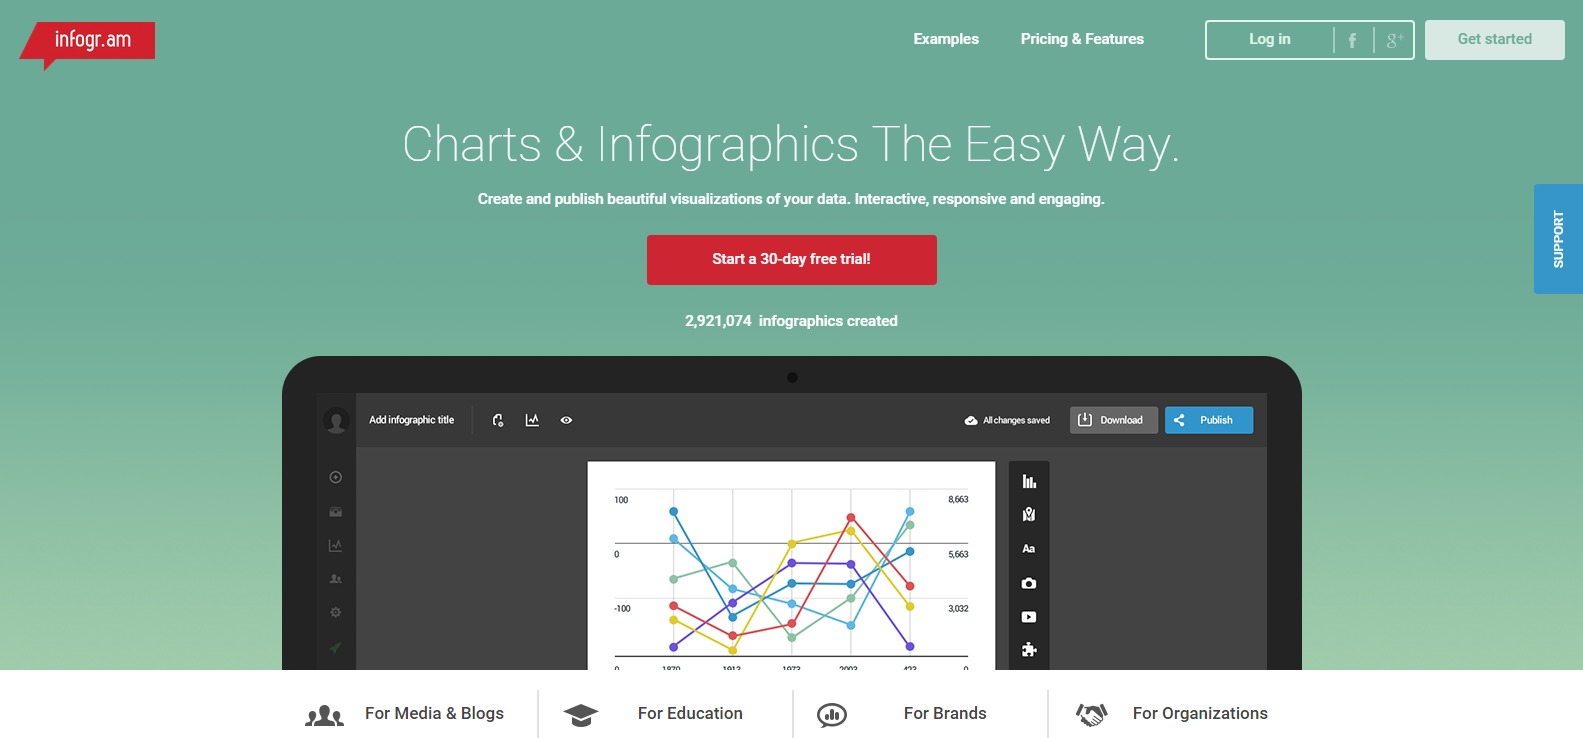
Infogr.am lets you create Infographics for your learning, business and marketing solutions. You can choose from over 30 different chart types and upload your own videos/images. You can embed your Infographics in blogs/websites and share privately/publicly online. When you’re happy with your infographic you can publish it to the Infogram website for all to enjoy and even embed it in to your own website or share it via social media.
https://infogr.am/
11. Google Developers
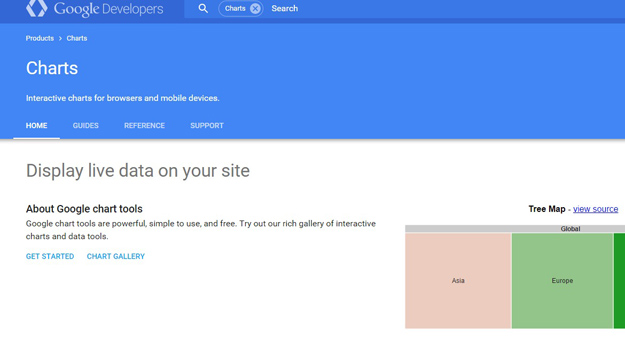
Google chart tools are powerful, simple to use, and free. You can choose from a variety of charts and configure an extensive set of options to perfectly match the look and feel of your website. By connecting your data in real time, Google Developers is the perfect infographic generator for your website.
12. iCharts
iCharts presents complex information through simple charts. The tool is used to demonstrate health indexes, trend practices, sales report, financial analysis report and more. iCharts offers various features, such as cloud services, real-time data access and information comparison.
13. Starsilk
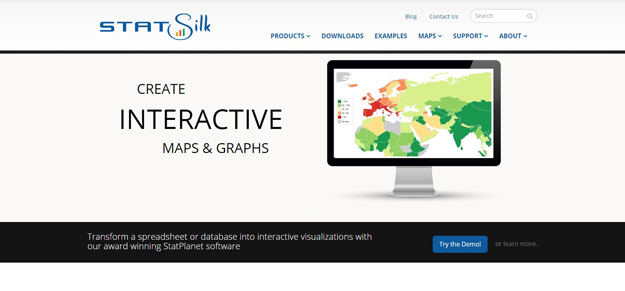
StatSilk is a powerful tool that transforms data on your spreadsheet in to interactive charts, maps, time series, scatter plots, bar charts and graphs. It offers unique features, such as zooming in to map areas, switching between different data sets and more.