Almost every company relies on data that helps them to understand their business precisely and effectively. In addition to being collected, raw looking data should be transformed into concise, interactive charts and graphs that will interest readers and help them to read the data and simplify things for users to comprehend.
For doing this We have compiled a list of Best JavaScript Data Visualization Libraries that will help you to transform your data into interactive, beautiful charts and graphs and help you to analysis your data to the depth. Following JavaScript Libraries let you visualize and create simple charts to high complex charts. Have Fun !!
1. JSCharting
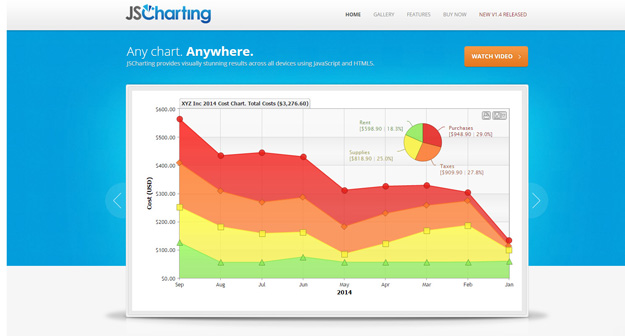
The JSCharting Library is a reliable way to increase the value of your website, by incorporating graphical charts and maps.
It offers several pre-built charts such as finance charts, area and bar charts, geo charts and pie or donut charts. All charts and maps are highly customizable which gives you complete control over the look and feel of your application. JSCharting offers many useful features such as inline formatting, smart tooltips, label tokens, code expansion, real time charts, browser compatibility, label expressions and many more.
JS Charting comes with geographic mapping support, including optimized data files for all country, province and state maps without the need of a separate product or add-on. The interesting part of JSCharting is it uses the same API for mapping which is used for regular charts and enables users to create new map charts quickly and easily.
You need to register at JSCharting to get the free trial while you can purchase the product for commercial usage.
2. Chartist.js

Chartist.js is a simple responsive charting library built with SVG. Chartist’s goal is to provide a simple, lightweight and non-intrusive library to responsive craft charts on your website. It’s important to understand that one of the main intentions of Chartist.js is to rely on standards rather than providing a own solution to the problem which is is already solved by the standard. Chartist works with inline-SVG and therefore leverages the power of the DOM to provide parts of its functionality. This also means that Chartist is not providing it’s own event handling, labels, behaviors and anything else that can just be done with plain HTML, JavaScript and CSS.
3. Vis.js
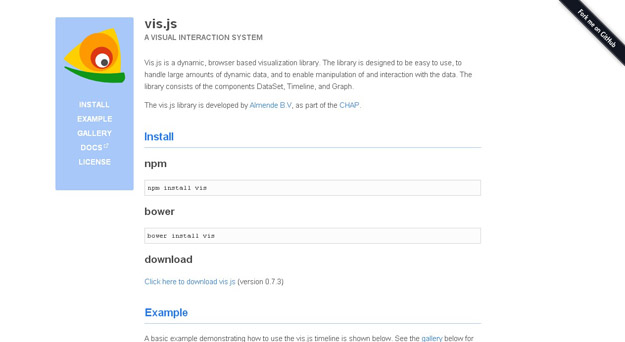
Vis.js is a dynamic, browser based visualization library. The library is designed to be easy to use, handle large amounts of dynamic data, and enable manipulation of the data.
The library consists of the following components: DataSet and DataView. A flexible key/value based data set. Add, update, and remove items. Subscribe on changes in the data set. Filter and order items and convert fields of items. Timeline.
4. Chart.js
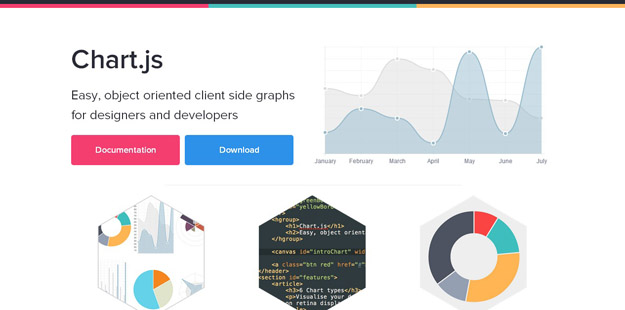
Chart.js is an easy, object oriented client side graphs for designers and developers. You can visualise your data in 6 different ways. Each of them animated, fully customizable and look great, even on retina displays. Chart.js uses the HTML5 canvas element. It supports all modern browsers, and polyfills provide support for IE7/8. Chart.js is dependency free, lightweight (4.5k when minified and gzipped) and offers loads of customization options. it is licensed under MIT License.
5. D3.js
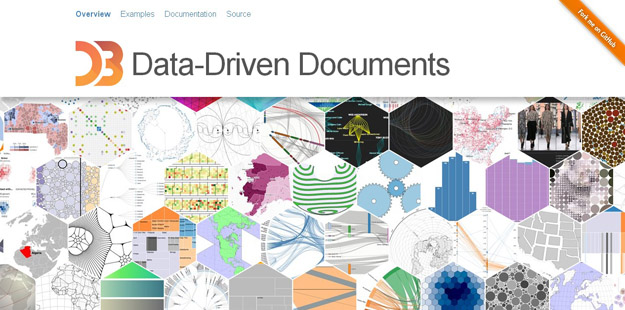
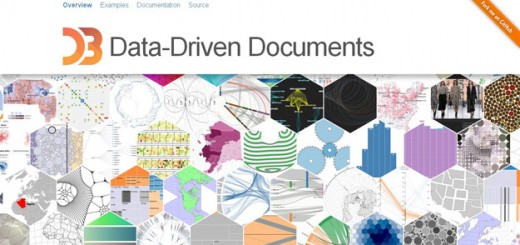
D3.js is a JavaScript library for manipulating documents based on data. D3 helps you bring data to life using HTML, SVG and CSS. D3’s emphasis on web standards gives you the full capabilities of modern browsers without tying yourself to a proprietary framework, combining powerful visualization components and a data-driven approach to DOM manipulation.
6. Ember Charts
Ember Charts is a charting library built with the Ember.js and d3.js frameworks. It includes time series, bar, pie, and scatter charts which are easy to extend and modify. The out-of-the-box behavior these chart components represents their thoughts on best practices in chart interactivity and presentation.
It is highly customizable and extensible. You can add legends, labels, tooltips, and mouseover effects. You can also roll your own charts by extending our ChartComponent class – get labels, automatic resizing, and reasonable defaults for margins, padding, etc.
7. xCharts
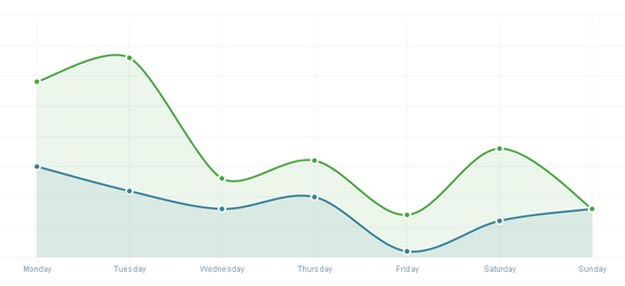
xCharts is a JavaScript library for building beautiful and custom data-driven chart visualizations for the web using D3.js. Using HTML, CSS, and SVG, xCharts are designed to be dynamic, fluid, and open to integrations and customization.
8. Sigma.js
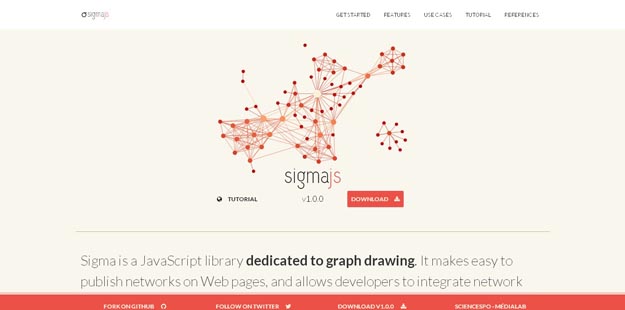
Sigma.js is a free and open-source JavaScript library to draw graphs, using the HTML5 canvas element. It has been especially designed to share interactive network maps on a Web page or to explore dynamically a network database. It is distributed under the MIT License.
9. Dygraphs.js
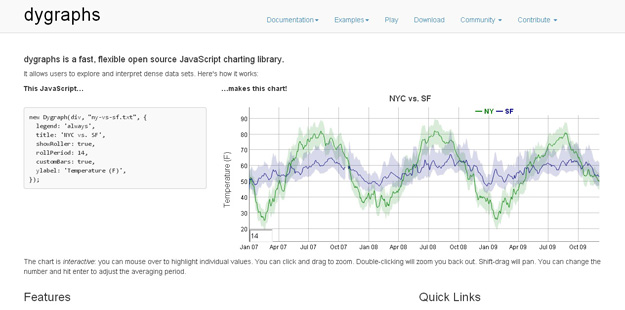
Dygraphs is fast, flexible open source JavaScript charting library. It allows users to explore and interpret dense data sets. ou can mouse over to highlight individual values. Click and drag to zoom. Double-click to zoom back out. Change the number and hit enter to adjust the averaging period.
10. Google Visualization API
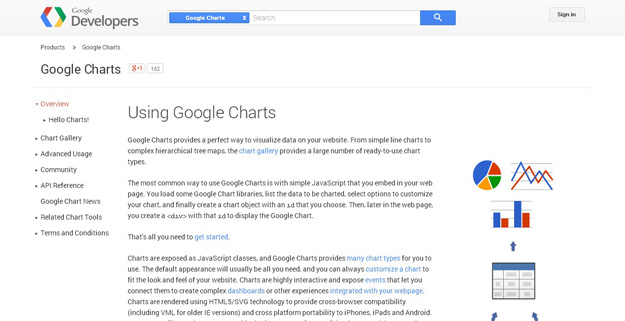
Google Charts provides a perfect way to visualize data on your website. From simple line charts to complex hierarchical tree maps, the chart gallery provides a large number of ready-to-use chart types. The most common way to use Google Charts is with simple JavaScript that you embed in your web page. You load some Google Chart libraries, list the data to be charted, select options to customize your chart, and finally create a chart object with an id that you choose. Then, later in the web page, you create a div with that id to display the Google Chart.
11. Raphael.js
Raphaël is a small JavaScript library that should simplify your work with vector graphics on the web. If you want to create your own specific chart or image crop and rotate widget, for example, you can achieve it simply and easily with this library.
12. Leaflet
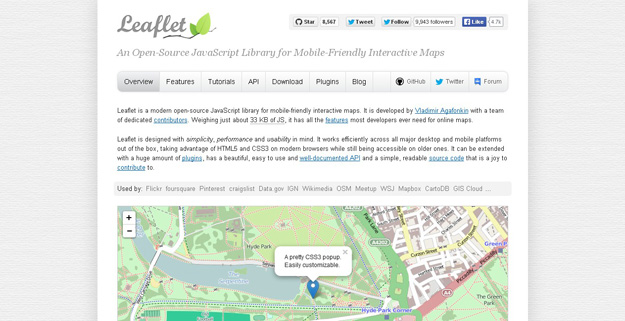
Leaflet is a modern open-source JavaScript library for mobile-friendly interactive maps. Leaflet is designed with simplicity, performance and usability in mind. It works efficiently across all major desktop and mobile platforms out of the box, taking advantage of HTML5 and CSS3 on modern browsers while still being accessible on older ones. It can be extended with a huge amount of plugins, has a beautiful, easy to use and well-documented API and a simple, readable source code that is a joy tocontribute to.
12. Polymaps
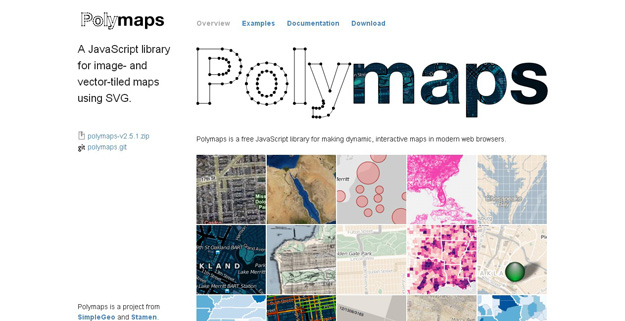
Polymaps is a free JavaScript library for making dynamic, interactive maps in modern web browsers. Polymaps provides speedy display of multi-zoom datasets over maps, and supports a variety of visual presentations for tiled vector data, in addition to the usual cartography from OpenStreetMap, CloudMade, Bing, and other providers of image-based web maps.
13. Springy.js
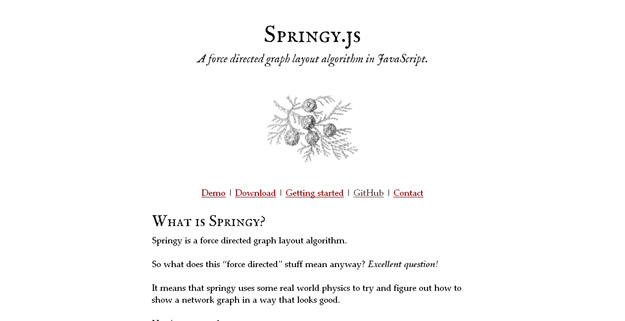
Springy.js is a JavaScript library that relies on an algorithm to create force-directed graphs, resulting in nodes reacting in a spring-like manner on the web page. Although Springy.js comes configured with a predefined algorithm, options such as spring stiffness and damping can easily be passed as parameters
14. Amcharts
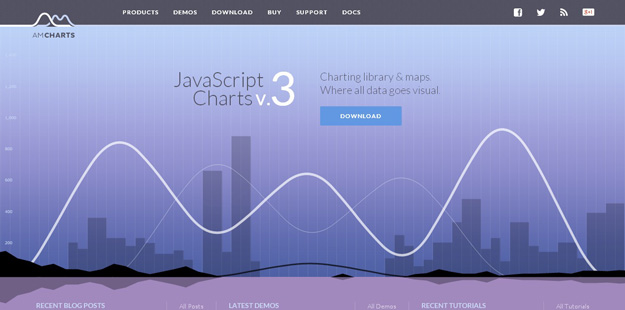
AmCharts is an advanced charting library that will suit any data visualization need. AmCharts includes Column, Bar, Line, Area, Step, Step without risers, Smoothed line, Candlestick, OHLC, Pie/Donut, Radar/ Polar, XY/Scatter/Bubble, Bullet, Funnel/Pyramid charts as well as Gauges.
15. Zing Chart
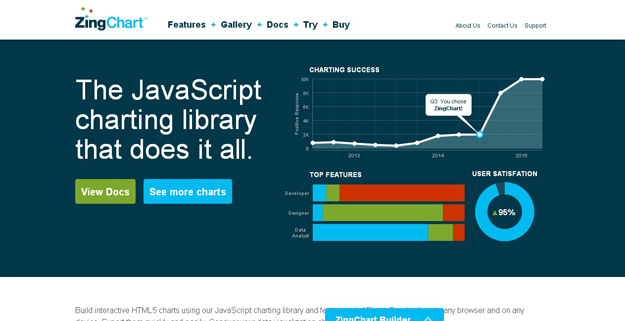
ZingChart is a powerful library providing users with the ability to quickly create beautiful charts, dashboards, and infographics. Choose from hundreds of chart types with nearly limitless chart design and customization options. Then, engage users with interactive chart features. Finally, connect your data and take granular control of your charts with our powerful API.
16. FusionCharts
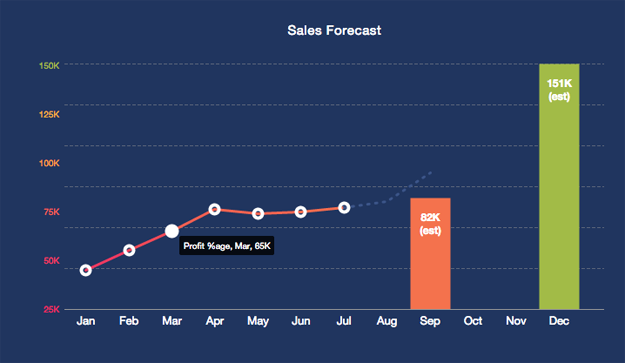
FusionCharts Suite XT is an extensive JavaScript charting library with 90+ chart types and 900+ maps covering the entire globe. It is a lightweight, JavaScript only library with easy integration capabilities with other popular JavaScript libraries (i.e. jQuery, AngularJS) and technology stacks (i.e. PHP, ASP.NET, RoR). The library consists of the regular cartesian charts (line, area, bar, column, pie, doughnut, combination, scatter, bubble, scroll charts) and other specialized charts with industry specific application (e.g. Marimekko charts, Gantt charts, Drag-node charts etc.). All charts and maps are highly customizable which gives you complete control over the look and feel of your application. Apart from the usual interactivity features FusionCharts includes support for annotations, event tracking and unlimited drill downs. FusionCharts is a good choice for developers with advanced needs.
Share with us your favorite JavaScript Data Visualization Libraries
We would be more than happy to hear from you what is your favorite JavaScript Data Visualization Libraries. Please share with us in the comment section below. If you like the article, please share it on Twitter, Facebook, Google Plus and other social networks. Thank you !!
